Summary:

The purpose of this project was to analyze how weather changes as you get closer to the equator. To reach this analysis, data was first pulled from OpenWeather API to assemble a database of over randomly selected 500 cities.
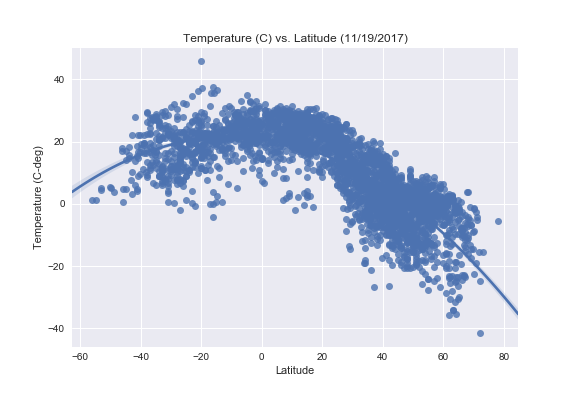
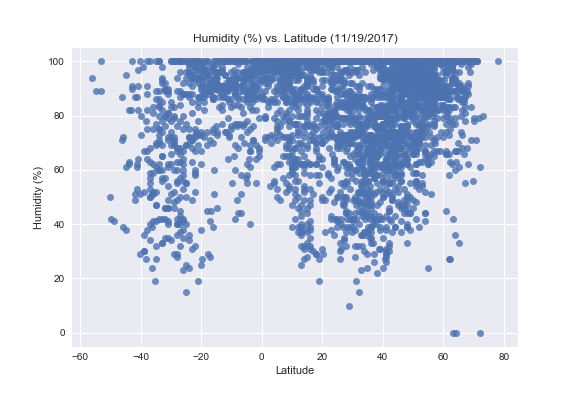
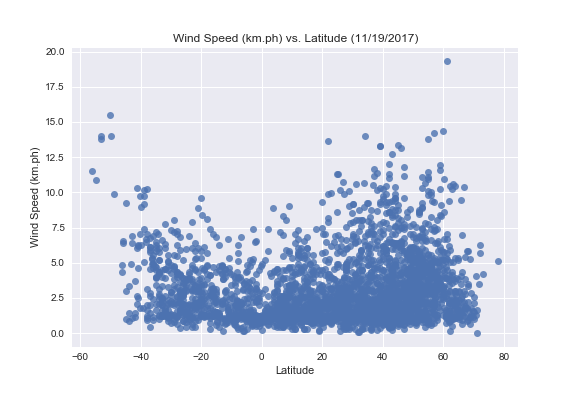
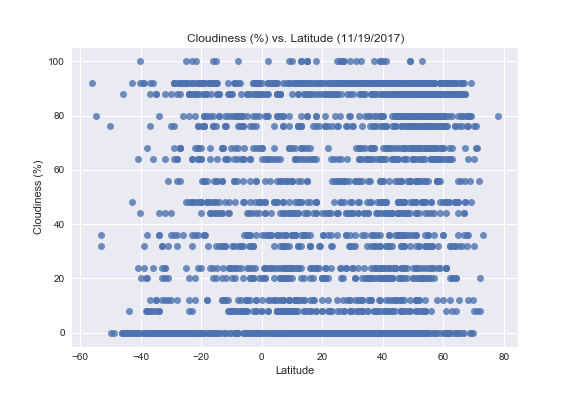
After assembling the dataset, a Python plotting library was used to plot various weather aspects vs. latitude. Measurements such as tempratures, cloudiness, wind speed, humidity and other weather parameters were used.
The website provides the source data, link to the workflow, and visualizations created as a part of the analysis and final analysis and observations.
Python Code Workflow:
- Random City Selection 2% of 209000 cities db
- Group Cities and req. API api.openweathermap.org
- Table Data, Report and Visualize


